

Study 7: VIX Movements & Local Tops (no code)
How reliably can moves in the fear index identify short-term peaks?

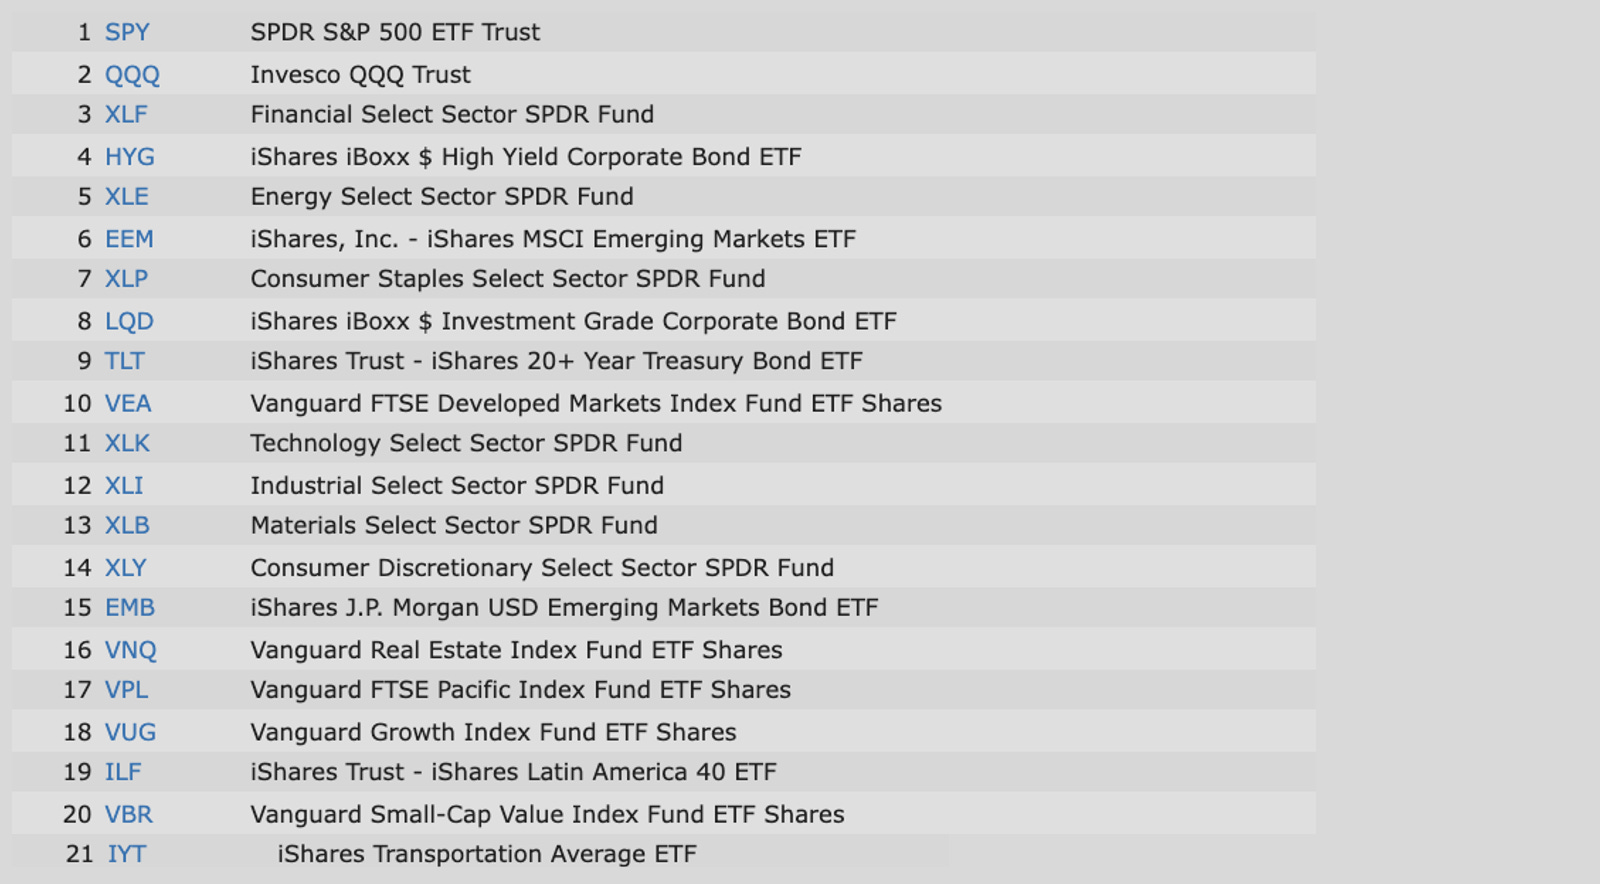
This study explores whether recent movements in the CBOE Volatility Index are a useful indicator for determining the odds of a local top taking place in various markets. We’ll use daily data from January 2004 to January 2022, focusing on a basket of liquid ETFs that track various macro themes like large-caps, value, emerging markets, and high-yield bonds (show below).
Methodology in Brief
First, we’ll compare the distribution of VIX movements in the overall population, with the distribution of movements only on days that are short-term peaks (filtered days). This technique is called reverse factor modeling. It helps us see if our x-variable behaves differently on the days we hope to identify, compared to how it behaves in general. If it does behave differently, we have a sign that this variable could offer insight.
If the distributions look different, we identify the parts of the filtered distribution that are the most unusual and use them to create a binary signal.
For example, suppose in the overall population our x-variable typically follows a bell-shaped distribution centered at 0. On days of interest, the x-variable values follow a different distribution, one with a much higher frequency of large positive values.
In this case, our signal is ON if our x-variable has a large positive value that is above some threshold. Otherwise, it is OFF. Then, we test the signal’s ability to properly identify market tops when it is ON.
PS: want to see the code for doing this yourself in Python? Check out this post!
We will then test that signal’s ability to identify local peaks, measuring its effectiveness using the F1 score, which ranges from 0 (poor reliability) to 1 (perfect reliability). This metric considers two main components:
Precision: what portion of our ON signals is actually correct
= (true positives) / (true positives + false positives)
Recall: what portion of all instances we hope to spot, we correctly spot
= (true positives) / (true positives + false negatives)
F1 = (2) x ((precision x recall) / (precision + recall))
Note that the code for this experiment is very similar to the code in the prior study, but if you have any questions, feel free to reach out!
Key Parameters
Our x-variable is the recent change in VIX. Since VIX is fairly stationary (has no long-term trend), we will measure its movement using simple subtraction, rather than by finding a % change. Otherwise, a movement from 13 to 14 will appear far larger than a move from than 31 to 32, even though in reality, those movements are similar. We need to select a lookback parameter, z. [change = VIX today - VIX z days ago]
We want to identify local tops in a particular asset, so for the second parameter, we need to select an asset to analyze.
Lastly, we need to decide how far we want to lookahead when defining whether a top has occurred.
For each parameter, we can create a list of possible values, and then find all the combinations of those potential parameter values to test.
Reverse Factor Modeling Results
The plots below highlight the two strongest findings during the reverse factor scan. Keep in mind, this is used for exploration and is a low bar. It doesn’t consider false alarms.
They both show that when LQD, an investment grade bonds ETF, is experiencing a local top (i.e., is equal to the maximum that we will see over the next 20 days), the trailing change in VIX tends to have higher frequencies of values greater than 0. The left graph uses a lookback period of 15 days for calculating VIX changes, and the right graph uses a lookback period of 17 days. Both are very similar to each other.
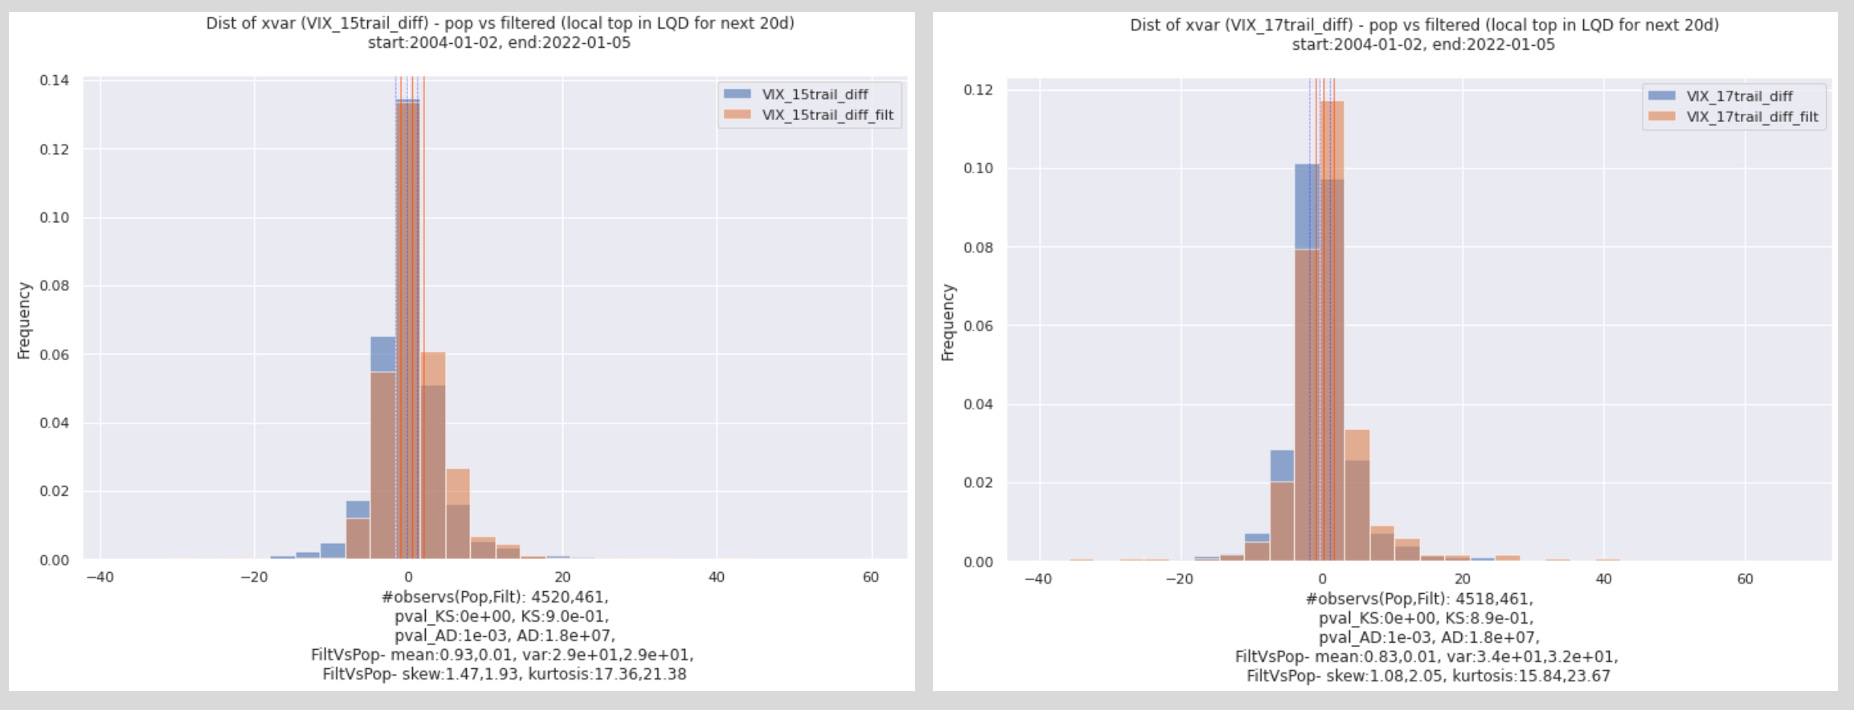
Now, we need to use these results to construct a binary signal. Since the filtered distribution has unusually high frequencies of values above 0, we will try to use 0 as a threshold; our signal will flash ON if the change in VIX is greater than 0.
Identification Results
Now, we can test this binary signal’s reliability by finding its F1 score. To increase the odds of detecting a decent signal, I decided to test a variety of thresholds and note the F1 score associated with each, in case the threshold that I estimated based on the above graphs was a bit off.
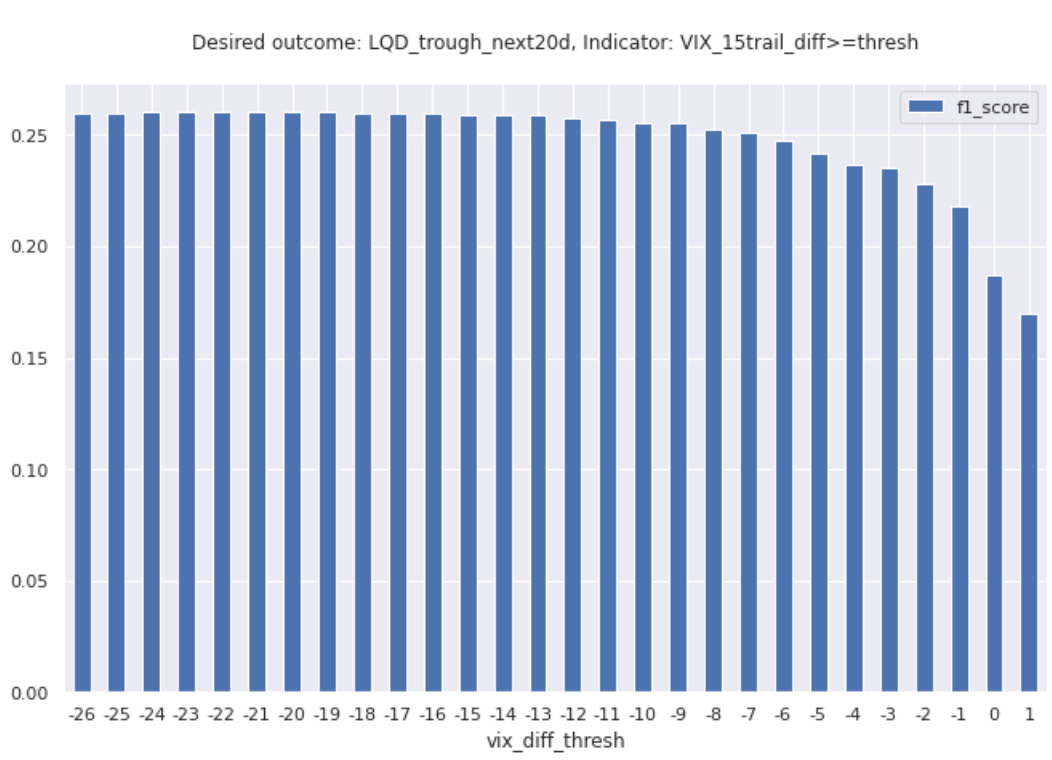
The graph below shows the results.
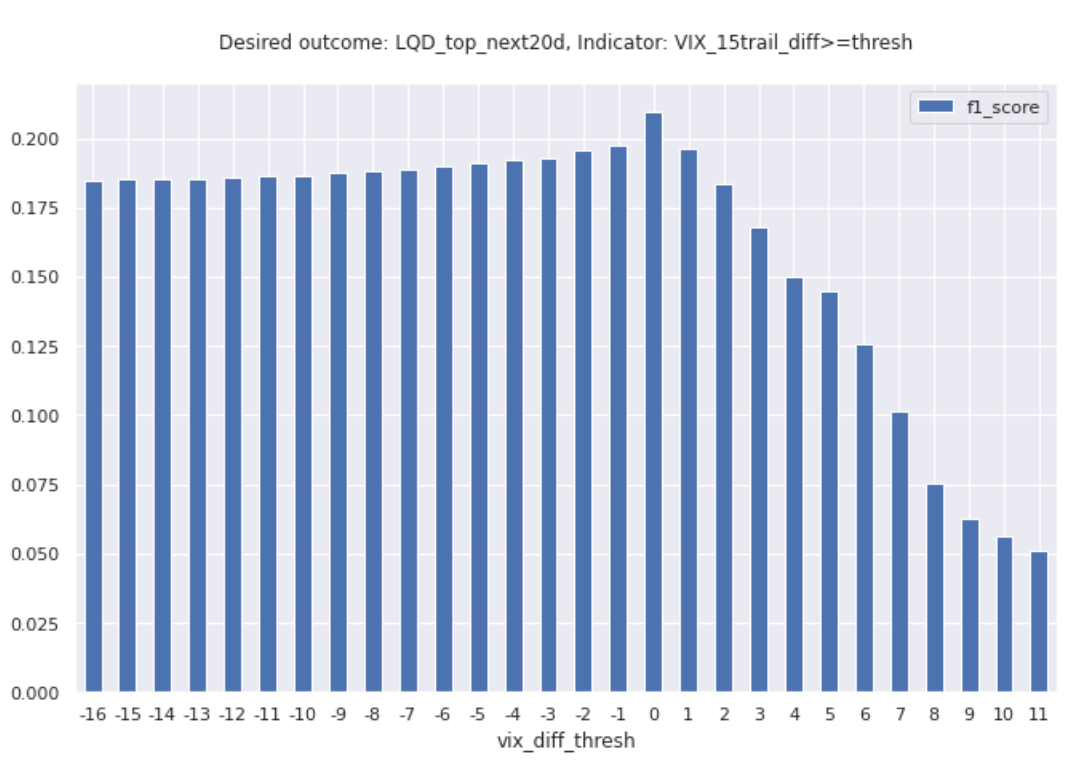
Out of all of these threshold options, the highest F1 score achieved was about .209, which is quite poor. Personally, I would require a score that’s at least slightly higher than 0.6 or so, at the minimum. Clearly, this indicator is not helpful in identifying tops.
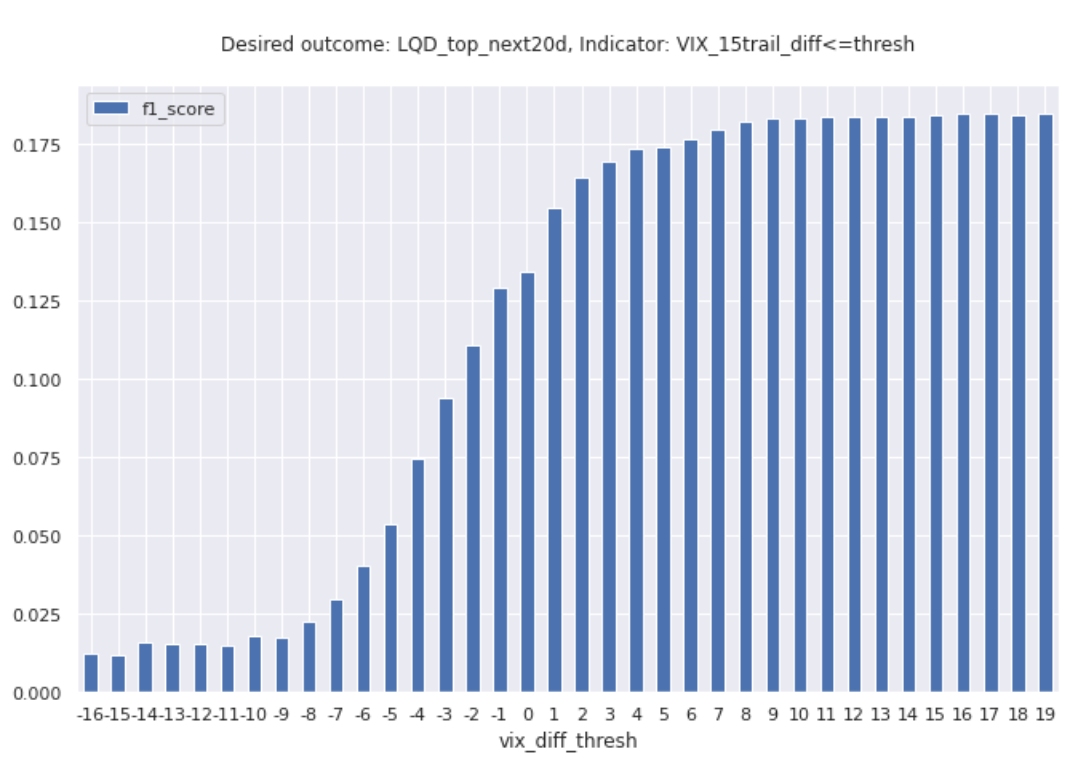
Out of curiosity, I also tried running this again, but having the indicator flash ON when the change in vix is *below* a certain threshold. The results were even worse, with an F1_score stabilizing below 0.18.
I also ran similar tests hoping to identify local troughs instead of peaks. The “VIX change > thresh” indicator performed a bit better, but still never even reached an F1 score of 0.30.
Overall, these results suggest that changes in VIX don’t have a very strong statistical relationship with the likelihood of a local top or peak in these ETFs.
Though we would prefer to find an indicator that is predictive, determining that an indicator is noise is still a success and a critical component for building a collection of statistical signals.
And that’s it folks! Hope this inspired some new ideas!