

Study 6: Dollar Regimes and Macro ETFs (no code)
How does the direction & volatility of UUP relate to future moves in other assets?

This study explores whether particular regimes in UUP (an ETF that tracks Dollar Index futures) have a statistically significant impact on the future behavior of other liquid assets. It also examines cross-asset relationships, such as the difference in future volatility of investment grade bonds and junk bonds.
To answer this question, we need to focus on variables we can actually bet on and see if their distributions tend to be different when a particular regime is present, compared to their distributions during the entire sample (from September 2006 to October 2021, for assets that go back that far).
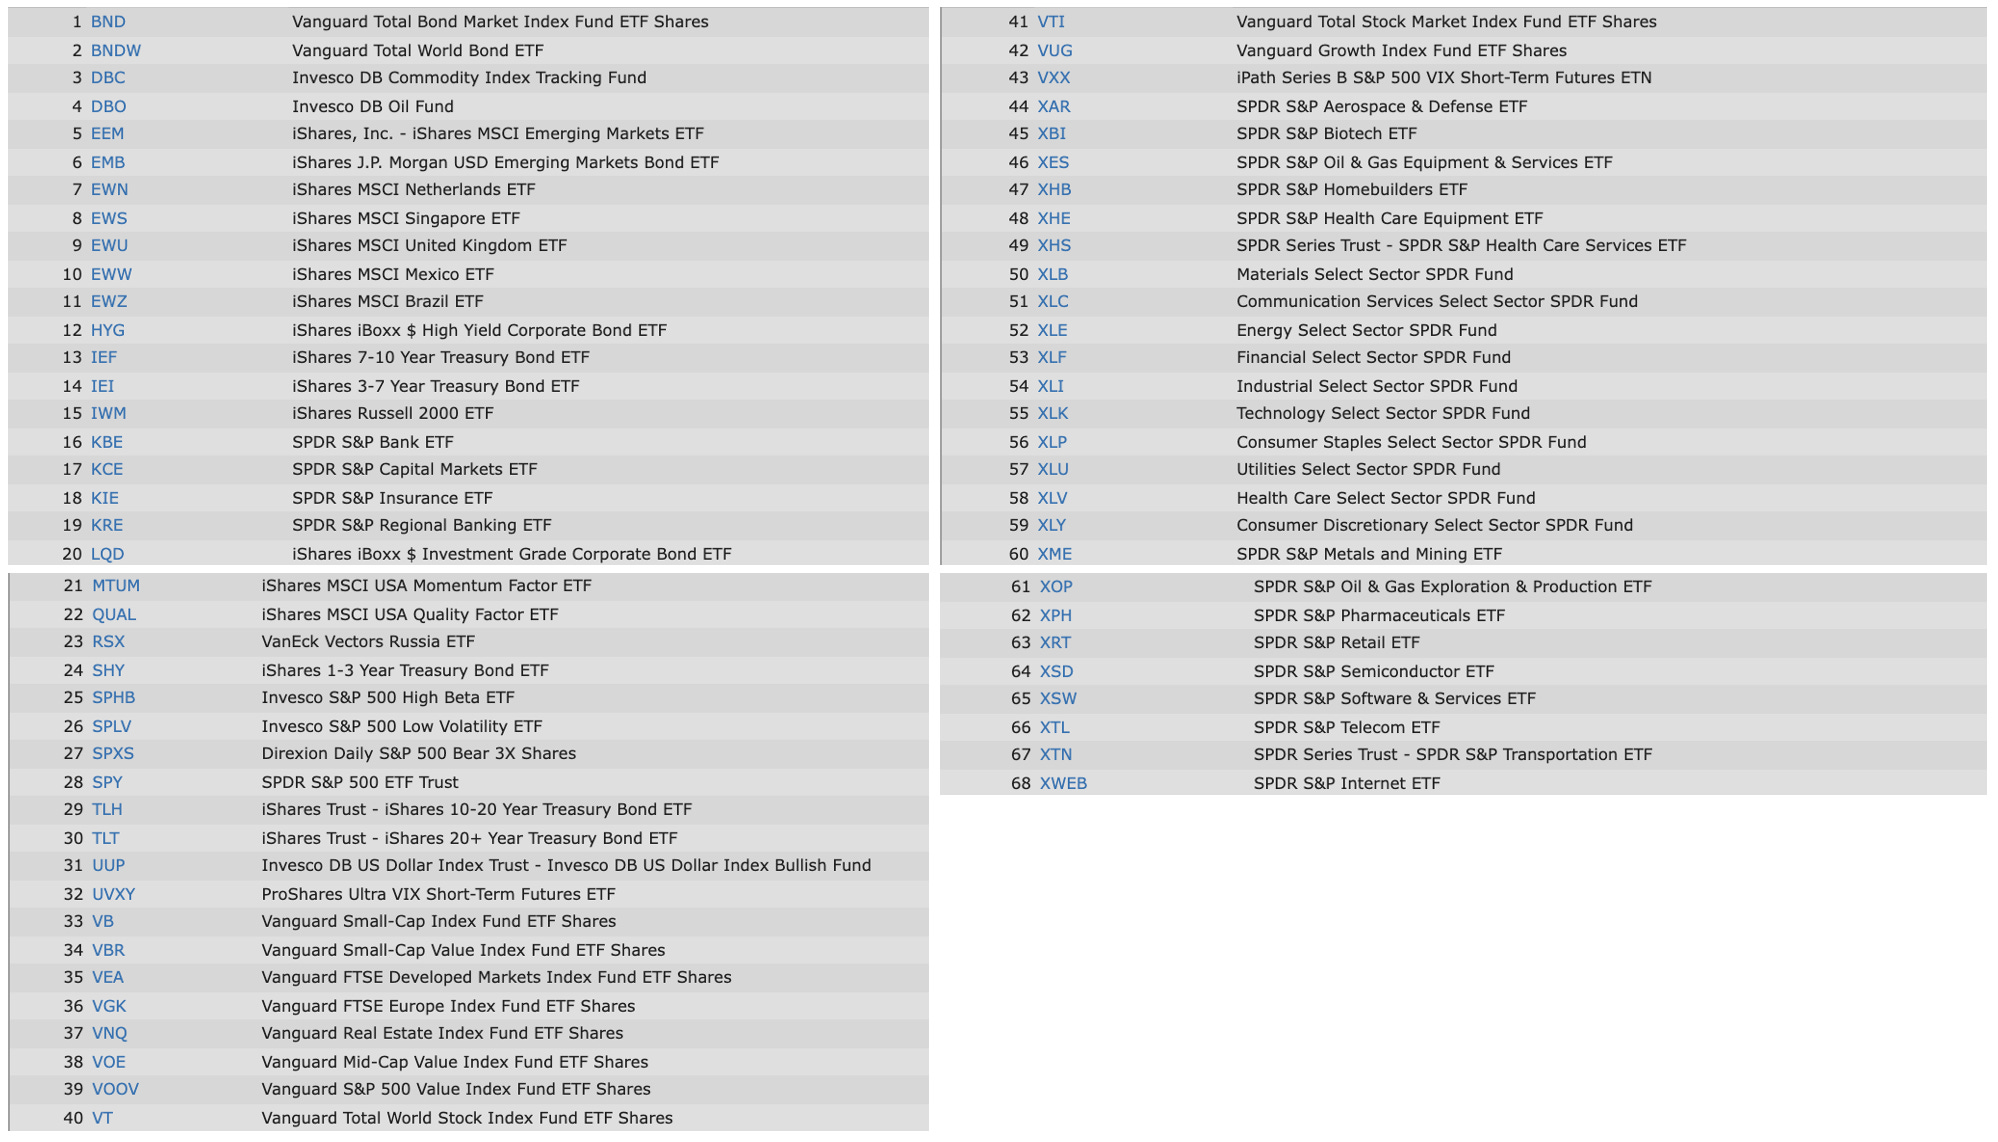
For assessing the future behavior of individual assets, I looked at a group of liquid ETFs that offer exposure to macro themes such as emerging markets, long-term U.S. debt, Russian equities, and various sectors within the S&P 500.
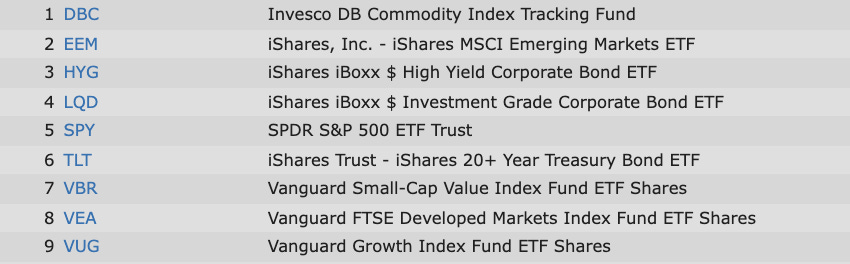
For looking at cross-asset relationships, I looked at a smaller group of macro ETFs to keep the number of potential pairs to explore more manageable.
Methodology in Brief
To identify regimes, we can look at the rolling returns and rolling volatility of UUP. For example, one regime type might be “high return, low volatility” while another could be “low return, medium volatility.” We will need a rolling window, like the past 20-days; I decided to use a range of lookback windows and tested all of them.
Once we have a window, we generate the rolling volatility and returns, and we find what quantile they each fall into. I considered five quantiles (0 through 4); quantile 0 indicates a datapoint that is in the lowest 20% of our sample, and quantile 4 indicates one in the highest 20%. Each regime is a unique pair of volatility and return quantile, such as [1, 3]. We then generate a list of these pairs and run through all of them.
Then, we select another asset (or pair of assets) that we might consider betting on, as well as which variable we might trade. That could be future returns, volatility, or max adverse excursion (MAE), which can be traded using options. I also considered risk-adjusted returns, by finding the sum of the future return and future MAE. Whatever variable we choose, it should have non-overlapping observations so we don’t think we have more data points and certainty than we really have.
Finally, we compare the distribution of that variable in the entire sample, versus when UUP is in a specific quantile. To compare them, we can calculate the 20th, 50th, and 80th percentile values for both distributions and find the difference between them, looking at the mean difference as a measurement of significance. We can also find the KS statistic and its associated p-value.
PS: want to see how to implement this yourself in Python? Check out this post!
Key Findings - Single Asset (Preview)
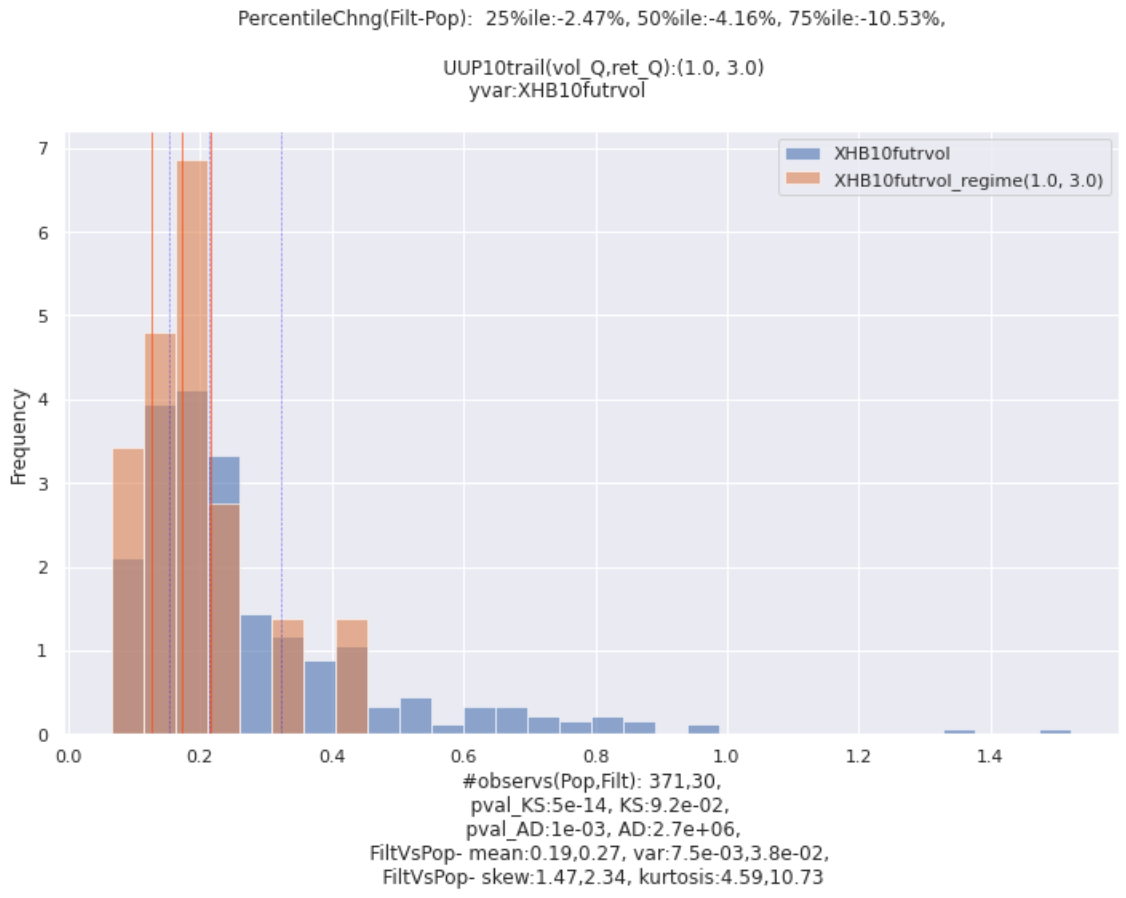
Regimes seemed to have a much more significant impact on future volatility compared to future returns or MAEs.
When UUP is in regime [1, 3], the future 10-day volatility of XLB, a homebuilders ETF, tends to be much lower than it usually is.
Key Findings - Cross-Asset Relationships (Preview)
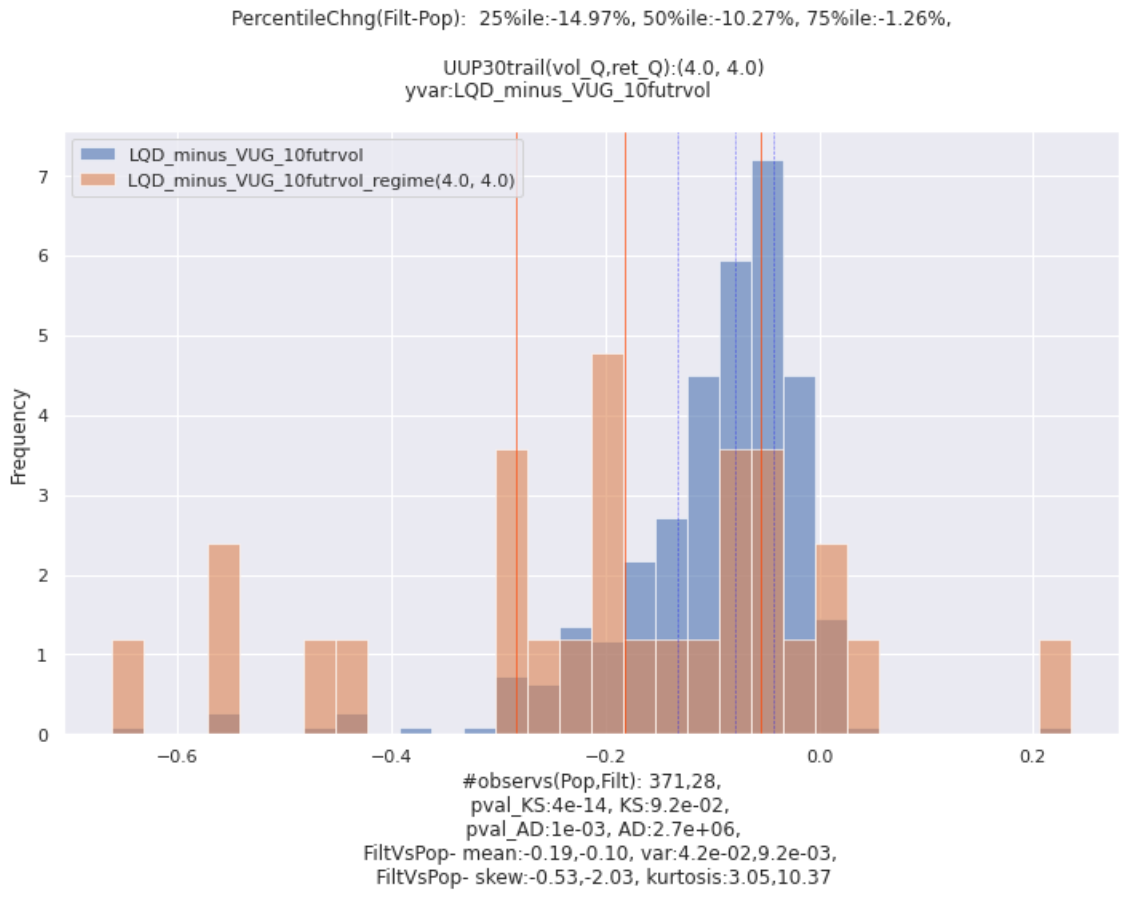
Regime [4, 4] is associated with the future 10-day volatility of LQD being unusually lower than the future 10-day volatility of VUG (Vanguard Growth Index Fund).
Code Walkthrough & Additional Findings
Additional findings and coding tips are located right here.
Hope this inspired some new ideas to explore! Cheers, and happy new year!